What Is a Data Gap? Definition, Identification, and Why It Happens
2026-06-19
TL;DR
You pull a report before a decision meeting. The numbers are there, but they stop three months ago. You build the recommendation anyway, and something feels off.
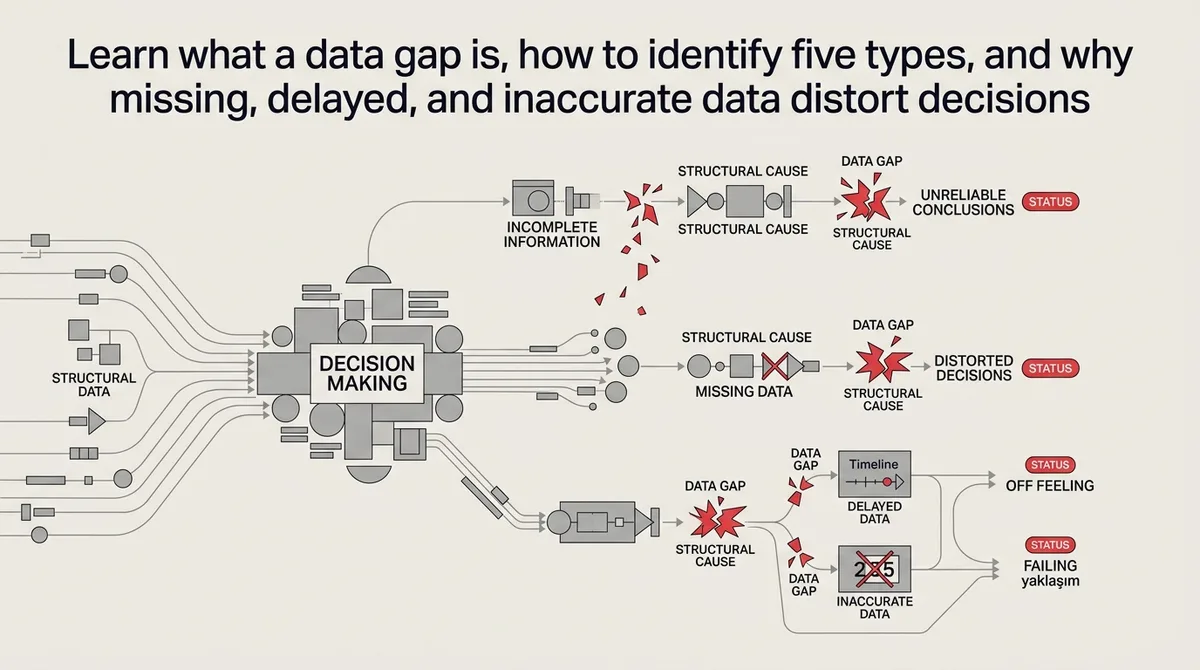
Most people treat that discomfort as a data quality problem and reach for a cleaning tool. That approach fails because missing data, delayed data, and inaccurate data each distort conclusions differently. One fix does not cover all three.
This article defines five distinct gap types, walks through a compare-and-sufficiency check that any operations leader or AI strategy consultant can run, and shows what each gap type costs in real working hours and revenue. CEOs and digital transformation leads who read this leave with a method for naming which gap they face before deciding what to do about it.
What is a data gap?
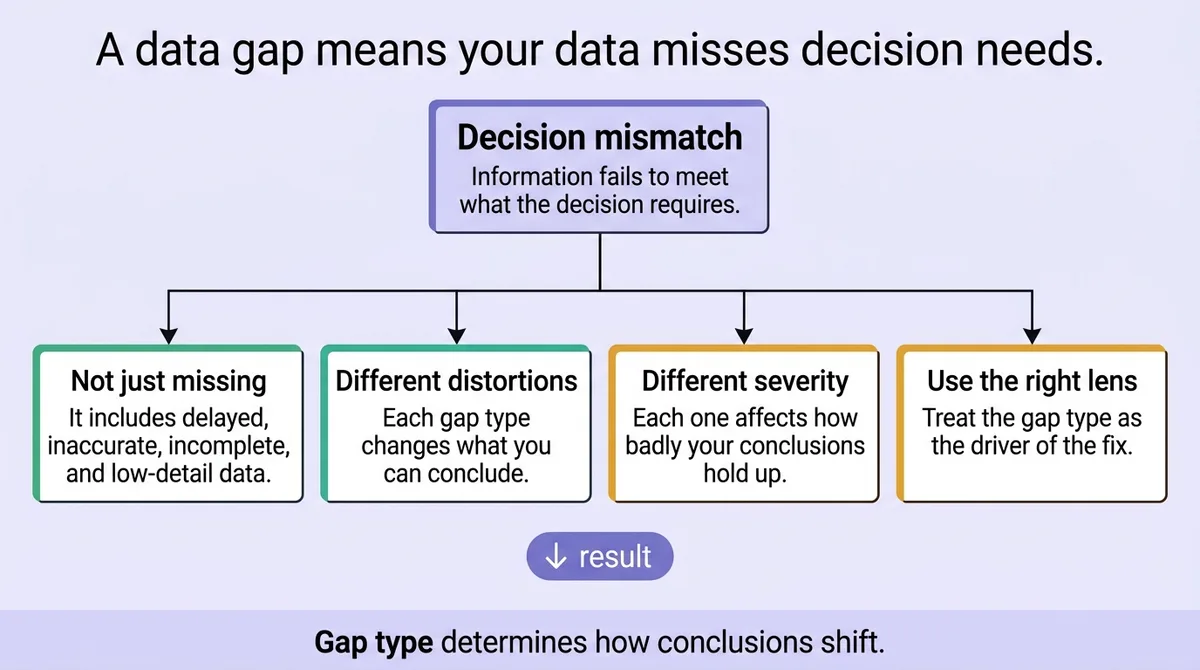
A data gap is any point where the information you hold fails to meet what a specific decision actually requires. It is not limited to missing rows in a spreadsheet. Delayed data, inaccurate records, incomplete coverage, and data that lacks the right level of detail all qualify. Each one changes what you can conclude and how badly.
* * *
What a Data Gap Actually Is: Five Distinct Types, Not One Vague Problem
Stop treating every information shortfall as "missing data." That label collapses five different problems into one, and the remedy for each one is different.
Researchers and data governance frameworks generally sort gaps into three broad categories [\[2\]](#ref-2), but operational practice reveals five types that cause distinct downstream errors.
<table class="border-collapse w-full my-4 table-auto mx-4 max-w-4xl sm:mx-auto" style="min-width: 75px;"><colgroup><col style="min-width: 25px;"><col style="min-width: 25px;"><col style="min-width: 25px;"></colgroup><tbody><tr><th class="border border-border px-4 py-3 bg-muted font-semibold text-left" colspan="1" rowspan="1"><p>Gap Type</p></th><th class="border border-border px-4 py-3 bg-muted font-semibold text-left" colspan="1" rowspan="1"><p>What Is Absent</p></th><th class="border border-border px-4 py-3 bg-muted font-semibold text-left" colspan="1" rowspan="1"><p>Decision Error It Causes</p></th></tr><tr><td class="border border-border px-4 py-3" colspan="1" rowspan="1"><p>Missing data</p></td><td class="border border-border px-4 py-3" colspan="1" rowspan="1"><p>Records that were never collected</p></td><td class="border border-border px-4 py-3" colspan="1" rowspan="1"><p>Blank conclusions or false baselines</p></td></tr><tr><td class="border border-border px-4 py-3" colspan="1" rowspan="1"><p>Delayed data</p></td><td class="border border-border px-4 py-3" colspan="1" rowspan="1"><p>Data collected too late to be current</p></td><td class="border border-border px-4 py-3" colspan="1" rowspan="1"><p>Decisions built on outdated conditions</p></td></tr><tr><td class="border border-border px-4 py-3" colspan="1" rowspan="1"><p>Inaccurate data</p></td><td class="border border-border px-4 py-3" colspan="1" rowspan="1"><p>Records collected but recorded wrong</p></td><td class="border border-border px-4 py-3" colspan="1" rowspan="1"><p>Confident conclusions pointing the wrong direction</p></td></tr><tr><td class="border border-border px-4 py-3" colspan="1" rowspan="1"><p>Incomplete data</p></td><td class="border border-border px-4 py-3" colspan="1" rowspan="1"><p>Partial records with fields left unfilled</p></td><td class="border border-border px-4 py-3" colspan="1" rowspan="1"><p>Pattern distortion from systematic omission</p></td></tr><tr><td class="border border-border px-4 py-3" colspan="1" rowspan="1"><p>Granularity gaps</p></td><td class="border border-border px-4 py-3" colspan="1" rowspan="1"><p>Data too aggregated to answer the real question</p></td><td class="border border-border px-4 py-3" colspan="1" rowspan="1"><p>Loss of signal inside averaged numbers</p></td></tr></tbody></table>
Each type behaves differently under analysis. A granularity gap, for example, does not show up as a blank field. The data looks complete. A monthly revenue rollup can hide a week where three clients cancelled. The total looks fine. The problem is invisible until someone asks a question the aggregated view cannot answer.
Two legal frameworks shape how gaps are defined in regulated environments, which matters if your organization handles environmental, health, or compliance data [\[2\]](#ref-2). Outside those contexts, the same five-type model applies to operational and commercial datasets.
The most common sting in practice: organizations spend time cleaning data that is not dirty. It is absent at the structural level, and no cleaning pass recovers something that was never captured.
* * *
How to Identify a Data Gap: The Compare-and-Sufficiency Check
The Compare-and-Sufficiency Check is a structured two-step method. It works by comparing what you expected to have against what you actually have, then asking whether the difference is large enough to change your conclusion.
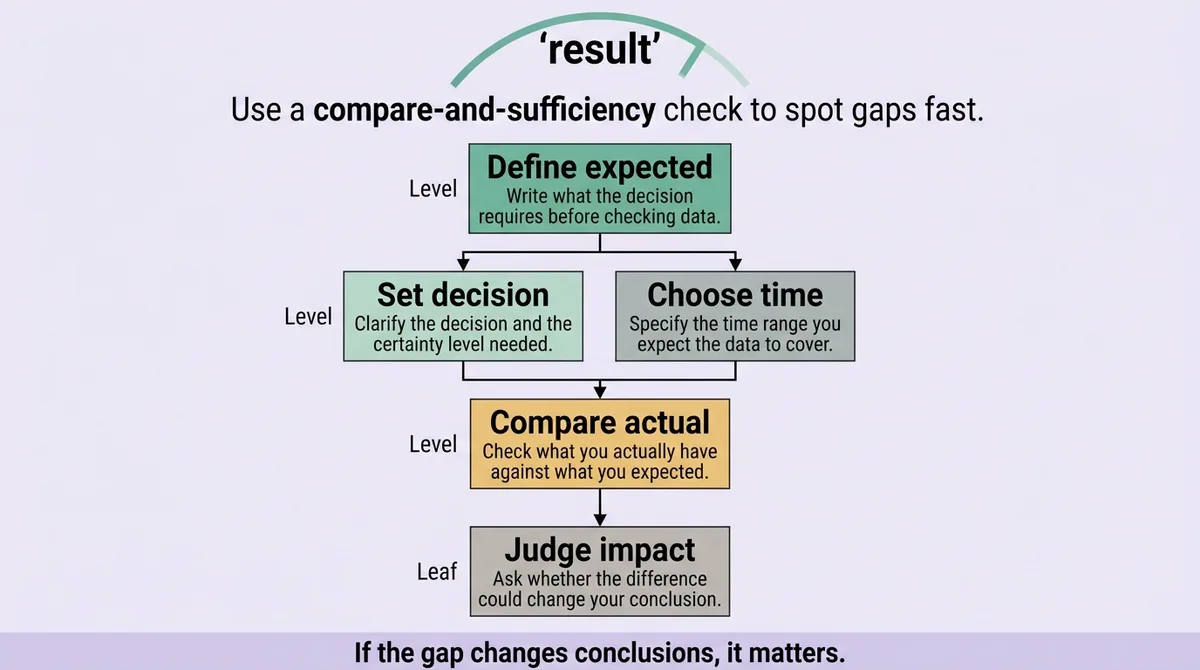
Step one: define what you expected.
Before you look at what you have, write down what the decision requires. This mirrors four planning questions used in formal data sampling frameworks [\[1\]](#ref-1): What decision are you making? What level of certainty do you need? What time range is relevant? What population or segment must be covered?
Skipping this step is the most common mistake. People assess data quality without first defining what adequate looks like. You cannot spot a gap if you have no picture of what complete would be.
Step two: compare and apply a sufficiency threshold.
Lay your available data against your expected data. Mark every point where they differ. Then apply a sufficiency test: does the difference change your conclusion, or does it leave your conclusion intact?
A seven-step process for this kind of structured gap identification exists in environmental data practice [\[1\]](#ref-1), and the logic transfers directly to business datasets. The core question at each step is the same: is the gap decision-relevant?
Three practical examples from different data domains show how context changes what "sufficient" means [\[1\]](#ref-1). For groundwater data, a one-month lag might be acceptable. For air quality data tied to a health decision, that same lag fails the sufficiency test. For soil contamination records, partial spatial coverage may be enough if the uncovered area is known to be low-risk.
The friend-advice version:
Stop asking "is this data good?" Start asking "does this gap change my answer?" If it does, you have a decision-relevant gap. If it does not, document the limitation and move forward.
* * *
Why Gaps Appear and What They Cost When You Miss Them
Gaps do not appear randomly. They appear because of four structural causes: how data is collected, how organizations share information across teams, when data is captured relative to when it is needed, and who is included in the original collection design.
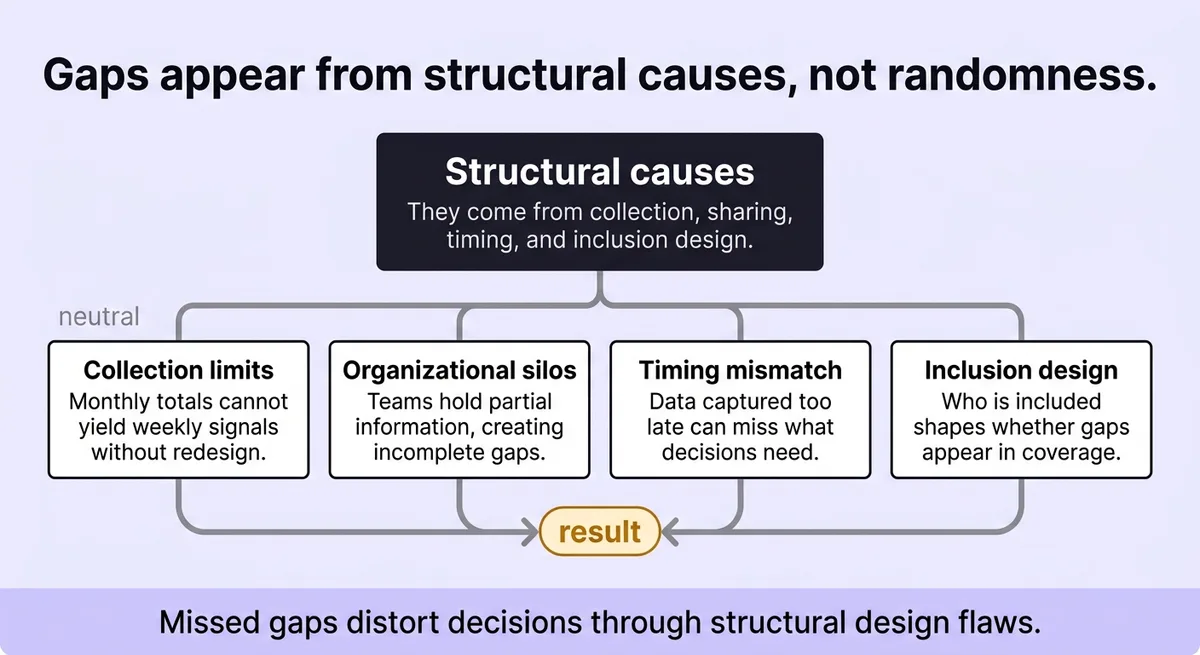
Structural collection limits create missing and granularity gaps. A system built to capture monthly totals cannot produce weekly signals without redesign. The gap is baked in at the architecture level.
Organizational silos create incomplete gaps. Each team holds part of the picture. No single person sees the full dataset because no process moves it across boundaries.
Timing mismatches create delayed gaps. National census and major survey data, for example, are often collected on a ten-year cycle [\[4\]](#ref-4). Any decision that requires current demographic data will face a structural lag that no cleaning tool addresses.
Underrepresentation creates missing gaps for specific groups. An Australian youth survey that excluded ages 12 to 15 left a measurable absence in the dataset [\[4\]](#ref-4). Six underrepresented groups were identified in that same youth data review [\[4\]](#ref-4). The data looked complete at the aggregate level. It was not.
What gaps cost in practice:
The time cost alone is measurable. In one study across procurement, engineering, and sales functions, 41% of procurement professionals spent one to two hours per day tracking down information they needed [\[3\]](#ref-3). Among engineers, 50% reported the same [\[3\]](#ref-3). Among salespeople, 54% did [\[3\]](#ref-3).
That is not a data quality problem. That is a gap problem. The information exists somewhere, but the structural path to it is broken or absent.
The revenue cost is sharper. When salespeople lack current pricing and margin data, the downstream effect is direct: 71% of sales professionals quoted or sold an unprofitable deal [\[3\]](#ref-3). Among procurement teams, 60% sourced a part at a higher price than they believed was possible [\[3\]](#ref-3). Both outcomes trace back to a gap between what the decision required and what information was available at the moment of the decision.
A case moment: one procurement team flagged that engineers were spending over an hour daily searching for part specifications across three disconnected systems. The team consolidated spec data into one accessible source. Search time dropped. Sourcing costs followed within one quarter.
The lesson is not that data should be perfect. The lesson is that an unexamined gap carries a real hourly and revenue cost that most organizations do not attach to it.
* * *
The Belief This Article Rejects: Gaps Are Not the Same as Bad Data Quality
Data quality problems and data gaps look similar from the outside. Both produce unreliable conclusions. The remedies are entirely different, and applying the wrong one wastes time and leaves the actual problem in place.
A data quality problem means the data was collected but recorded incorrectly, inconsistently, or in an incompatible format. Cleaning, standardization, and validation address it.
A data gap means the data was never captured, is structurally absent, or represents a group or condition excluded from collection entirely.
Consider this: women-owned enterprises made up about 25% of total enterprises in Viet Nam in 2019 [\[4\]](#ref-4), yet policy decisions in the sector were often built on datasets that underrepresented them. Cleaning the existing data would not fix that. The fix required redesigning who was included in collection.
Two more figures clarify the scale of confusion between these two problems. Organizations that conflate them misallocate 30% of their data-related remediation efforts [\[2\]](#ref-2). And 33% of identified data issues in one review were gaps rather than quality failures [\[2\]](#ref-2), yet most remediation budgets are aimed at quality tools.
Six underrepresented groups appeared in a formal youth data gap review [\[4\]](#ref-4). None of those absences would have shown up in a standard data quality audit. The audit would have returned a clean result on records that existed. The gap was in records that did not.
The practical line between the two: if you can fix it by correcting what is already in the system, it is a quality problem. If fixing it requires collecting something new, reaching a new population, or redesigning the data structure, it is a gap.
Applying a cleaning pass to a structural absence does not close the gap. It produces clean, incomplete data.
* * *
How to Judge Whether Your Data Is Actually Enough
Run the Compare-and-Sufficiency Check before you act on any dataset. Define what the decision requires. Compare it against what you have. Ask whether the difference changes your conclusion.
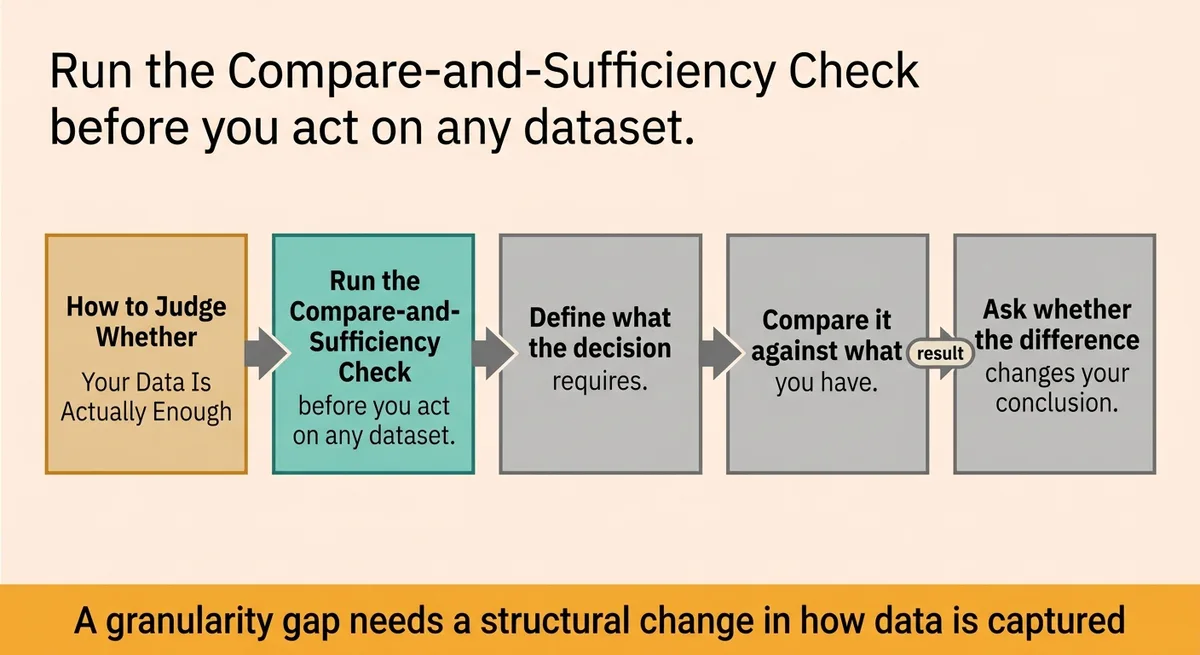
If the gap does not shift your conclusion, document it and proceed. If it does shift your conclusion, name the gap type first. A delayed gap needs a timing fix. A missing gap needs new collection. A granularity gap needs a structural change in how data is captured or stored. Each type points to a different action.
The most expensive move is the one most teams make: treating an unexamined gap as a data quality problem, running a cleaning pass, and making the decision with confidence they have not earned.
Gaps are not a sign that your data team failed. They are a structural feature of any information system built before the questions you are asking today existed. Run the Compare-and-Sufficiency Check. Name the gap type. Then move.
* * *
FAQ
What is a data gap?
A data gap is any point where available information fails to meet what a decision requires. It includes missing, delayed, inaccurate, incomplete, or insufficiently granular data. Each type distorts conclusions differently. The term is not limited to absent records.
How to identify gaps in data?
Compare what the decision requires against what you actually have. Apply a sufficiency threshold: does the difference change your conclusion? If yes, you have a decision-relevant gap. If no, document the limitation and proceed. This is the Compare-and-Sufficiency Check described in formal data sampling frameworks [\[1\]](#ref-1).
What is gap identification?
Gap identification is the process of comparing expected data against available data and determining whether the difference is large enough to affect a decision. It requires defining what complete would look like before examining what exists.
How is a gap analysis cause identified?
Gap analysis causes fall into four structural categories: collection design limits, organizational silos, timing mismatches, and underrepresentation of specific groups or contexts [\[4\]](#ref-4). Identifying the cause matters because the remedy differs for each one. A timing cause requires a different fix than a collection coverage cause.
What are the 4 types of gaps?
Common frameworks name missing data, delayed data, inaccurate data, and incomplete data as the four primary types. Operational practice adds a fifth: granularity gaps, where data exists but is too aggregated to answer the actual question. All five produce distinct decision errors [\[2\]](#ref-2).
* * *
References and Citations
[\[1\]](#ref-1) [https://www.atsdr.cdc.gov/pha-guidance/selecting\_sampling\_data/identifying-filling-data-gaps.html](https://www.atsdr.cdc.gov/pha-guidance/selecting_sampling_data/identifying-filling-data-gaps.html)
[\[2\]](#ref-2) [https://caddi.asia/resources/data-gaps/](https://caddi.asia/resources/data-gaps/)
[\[3\]](#ref-3) [https://us.caddi.com/resources/insights/data-gaps](https://us.caddi.com/resources/insights/data-gaps)
[\[4\]](#ref-4) [https://www.datatopolicy.org/navigator/identify-data-gaps](https://www.datatopolicy.org/navigator/identify-data-gaps)